
GIS (Digital Mapping)
What Is GIS
Esri
UWGB
American Digital Cartography
Graef, Anhalt, Schloemer
Earth Tech
McMahon
Menominee Indian Tribe of WI
Geographic Information Systems (GIS)
Geographic Information Systems (GIS)
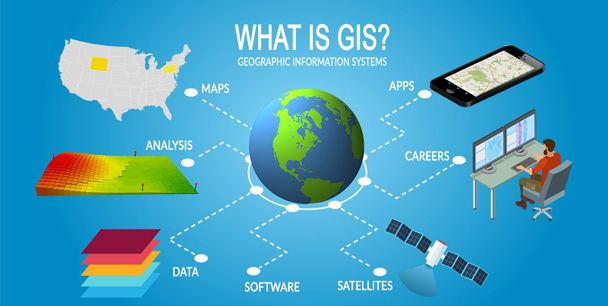
Definition of GIS
A geographic information system (GIS) is a system designed to capture, store, manipulate, analyze, manage, and present all types of geographical data. The key word to this technology is Geography – this means that some portion of the data is spatial. In other words, data that is in some way referenced to locations on the earth. Coupled with this data is usually tabular data known as attribute data. Attribute data can be generally defined as additional information about each of the spatial features. An example of this would be schools. The actual location of the schools is the spatial data. Additional data such as the school name, level of education taught, and student capacity would make up the attribute data. It is the partnership of these two data types that enables GIS to be such an effective problem-solving tool through spatial analysis. GIS is more than just software. People and methods are combined with geospatial software and tools, to enable spatial analysis, management of large datasets, and the display of information in a map/graphical form.
GIS Concepts
What can we do with GIS?GIS can be used as tool in both problem solving and decision making processes, as well as for visualization of data in a spatial environment. Geospatial data can be analyzed to determine (1) the location of features and relationships to other features, (2) where the most and/or least of some feature exists, (3) the density of features in a given space, (4) what is happening inside an area of interest (AOI), (5) what is happening nearby some feature or phenomenon, and (6) and how a specific area has changed over time (and in what way).
1. Mapping where things are. We can map the spatial location of real-world features and visualize the spatial relationships among them.
2. Mapping quantities. People map quantities, indicating the relative prevalence of some kind of entity or resource, to find places that meet their criteria or to see the relationships between places.
3. Mapping densities. Sometimes it is more important to map concentrations, or a quantity normalized by area.
4. Finding what is inside. We can use GIS to determine what is happening or what features are located inside a specific area/region. We can determine the characteristics of "inside" by creating specific criteria to define an area of interest (AOI).
5. Finding what is nearby. We can find out what is happening within a set distance of a feature or event by mapping what is nearby using geoprocessing tools like BUFFER.
6. Mapping change. We can map the change in a specific geographic area to anticipate future conditions, decide on a course of action, or to evaluate the results of an action or policy.
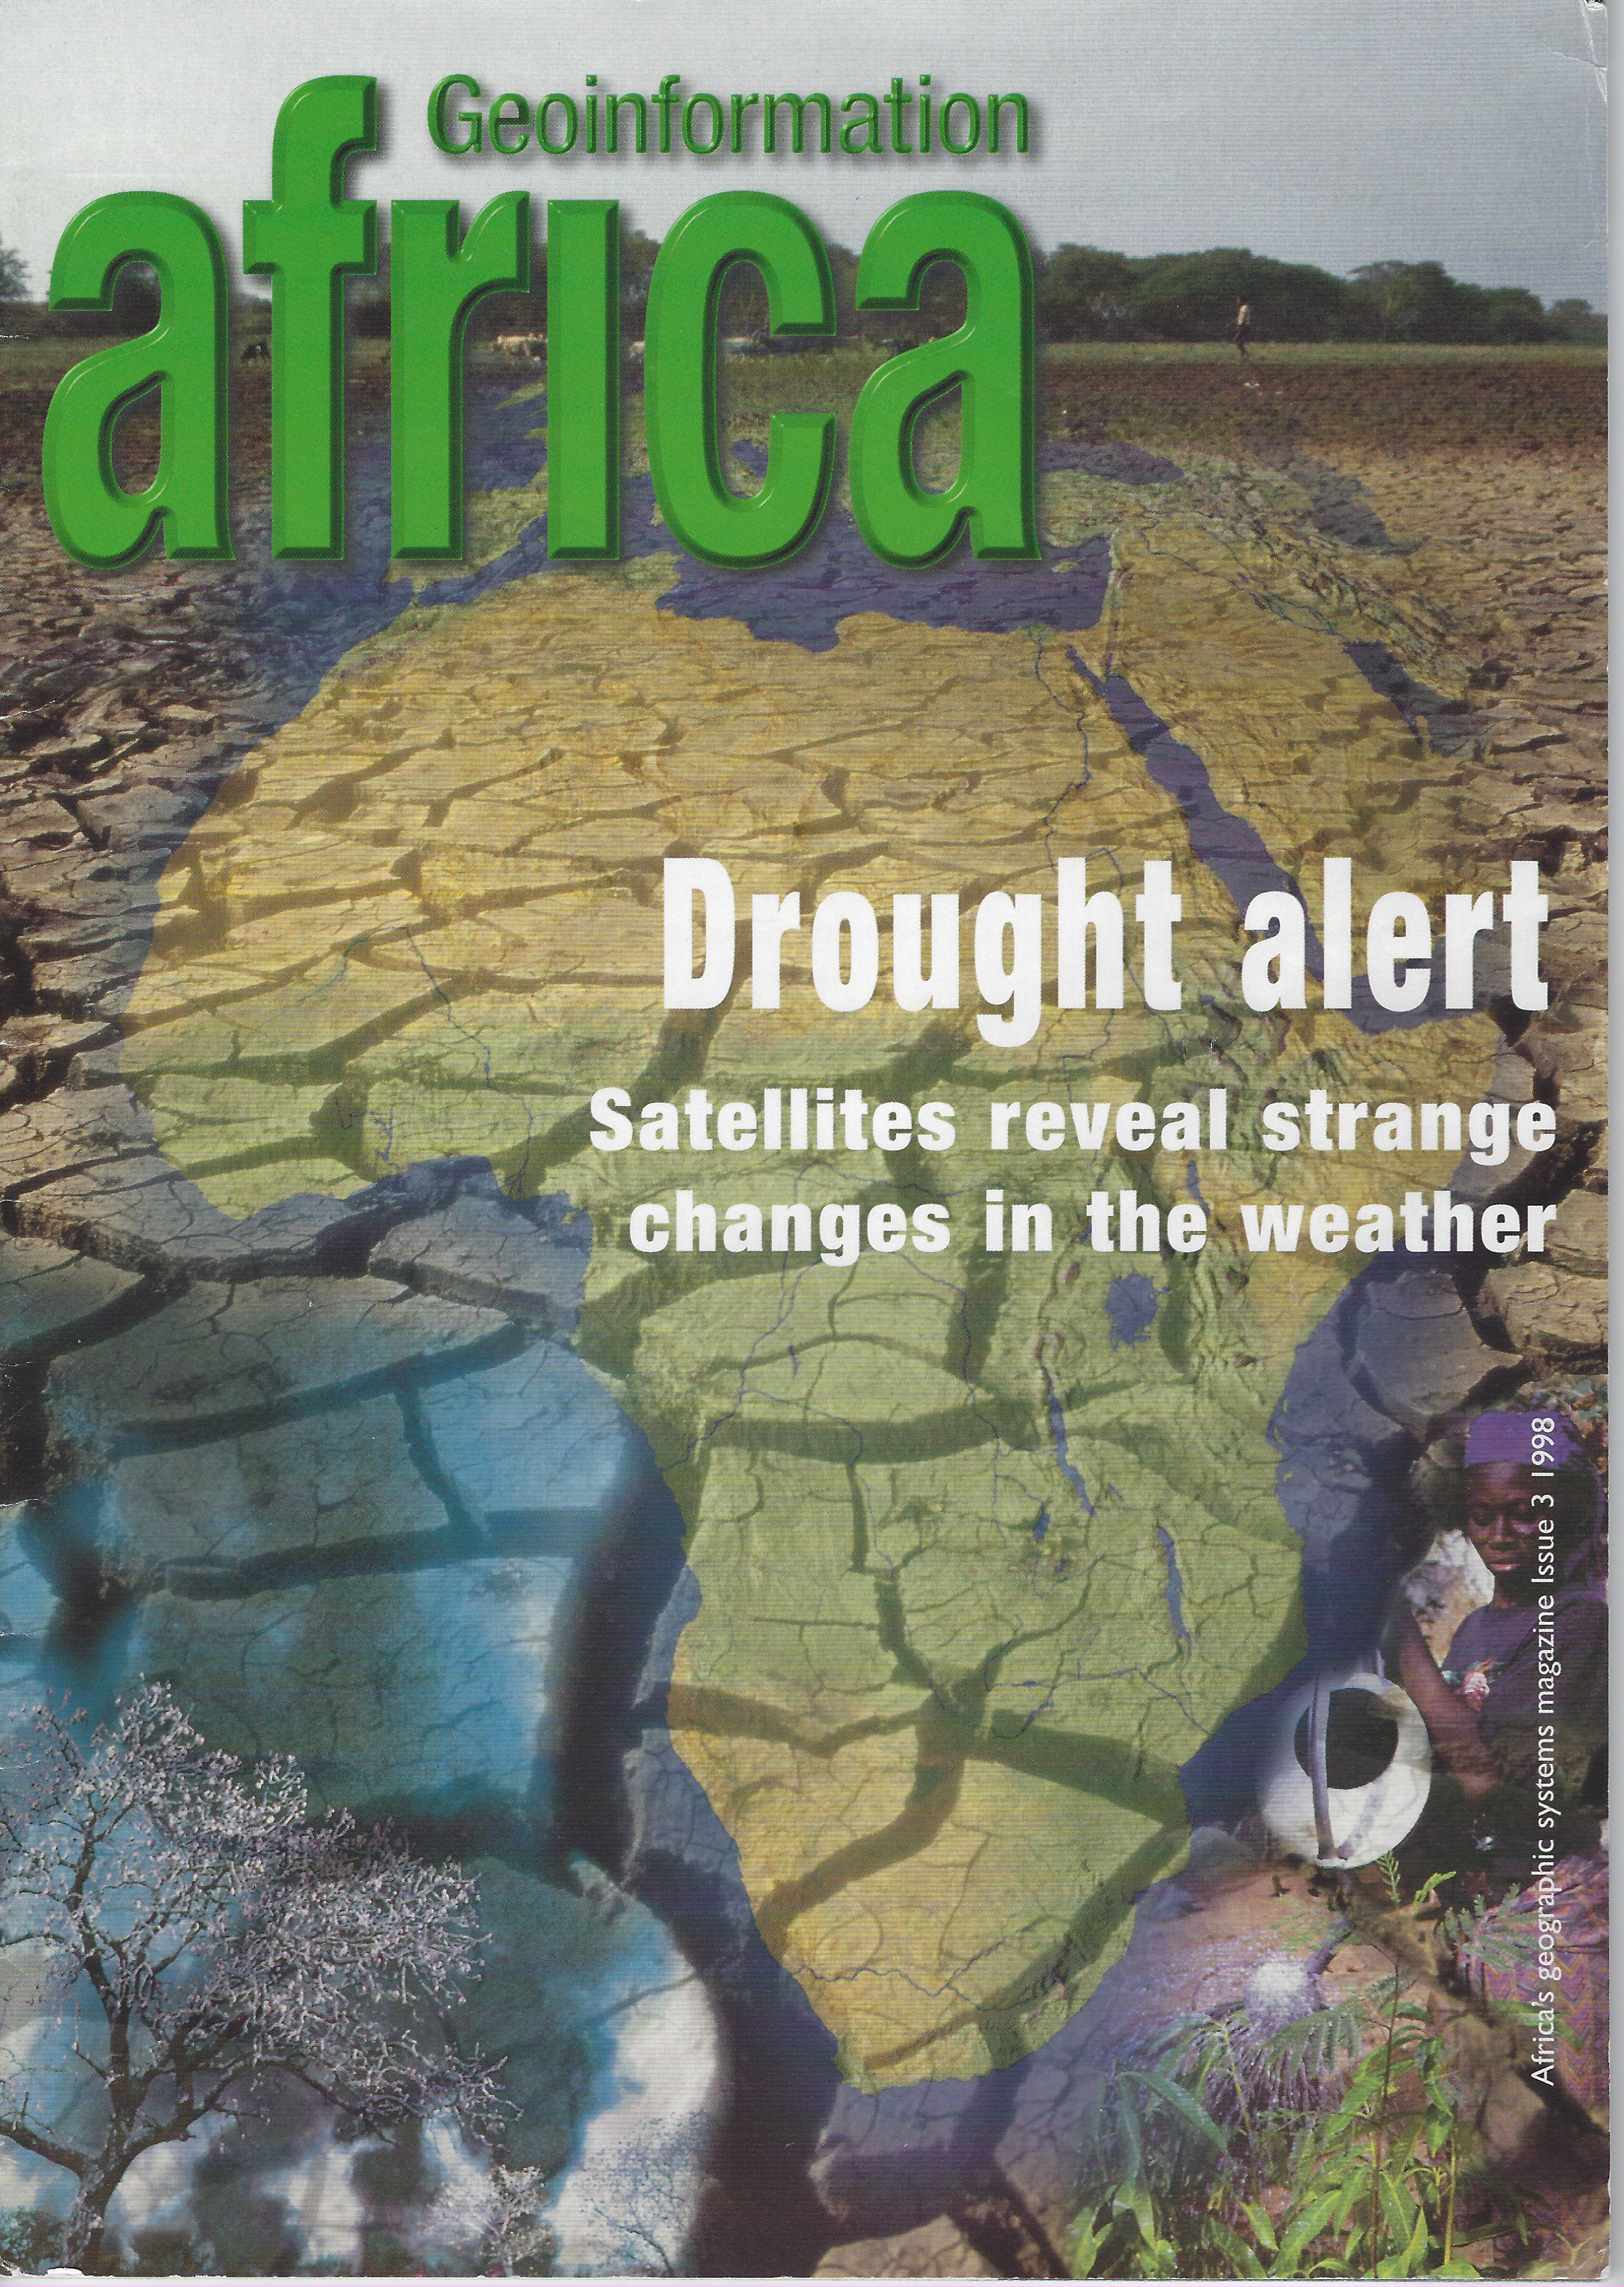
However, GIS had some great ad's in the day.
 |
 |
From the gallery
GIS Images
 |
 |
 |